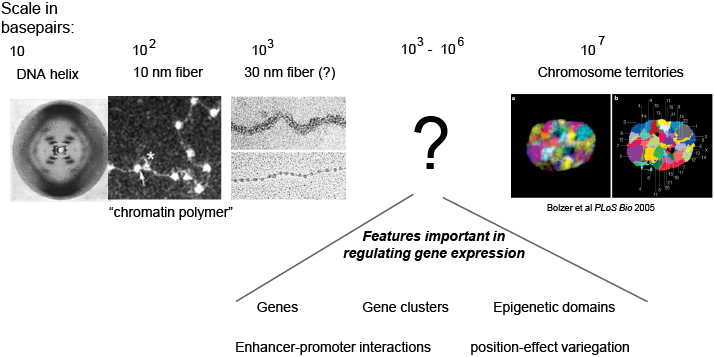
Differences in gene expression arise due to differences in how accessible the sequence encoding a gene is to the transcription machinery of the cell. While we know much about the structure of DNA at small lengths scales (<1 kilobase) and at large length scales (whole chromosomes), we understand little about its organization at the intermediate scale of kilobases to megabases. This is unfortunate, because this is the length scale of genes, epigenetic domains, enhancer promoter interactions, and many other phenomenon critical to regulating gene expression.
Oligo-STORM reveals details of chromatin structure at kb-Mb scales
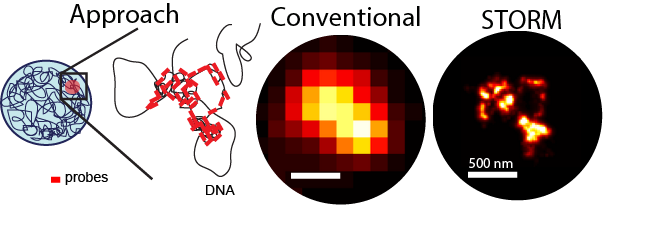
We use array-based DNA synthesis and library expansion to generate “Oligopaints” – fluorescently labeled oligos which can densely tile a region of interest on the genome. Imaged with a conventional microscope, these produce only a diffraction limited spot, since the 10-nm fiber is much smaller than the 500 nm wavelength of fluorescent light. Using super-resolution STORM imaging, we can bypass this limit to reveal rich structural feature, including dense regions, less dense regions, and spacious chromatin loops, as illustrated above.
Chromatin packaging depends on TF occupancy
With this method we have imaged ~50 different domains from the Drosophila genome, each enriched in a distinct class of transcription factor (TF) activity and carrying distinct epigenetic marks (shown in red blue and black in the image, left). We found these regions have clearly distinct structural organization,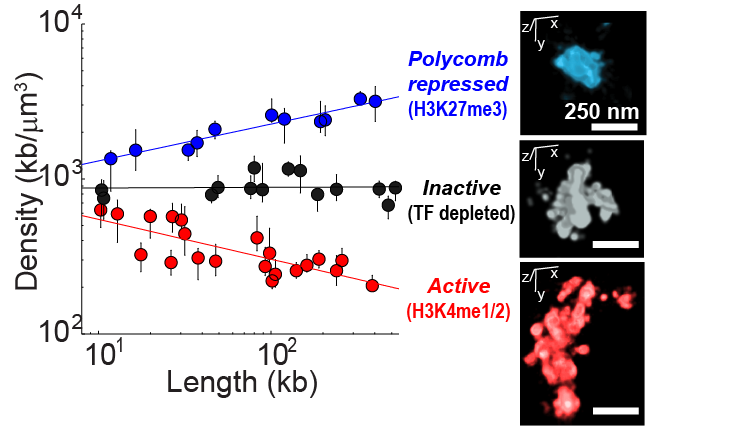 including different packaging densities. Interestingly, the density of the domain showed power-law scaling with the length of the domain, with a unique scaling exponent for each distinct chromatin class. Inactive chromatin is “Naive” and bound by few TFs. It exhibits similar density at all length scales. Active chromatin gets less dense in longer domains. Polycomb bound chromatin is more densely packed when it occurs in long domains than when it arises in isolated stretches. These disitnct forms of chromatin packaging suggest a mechanistic link between the TFs that bind these domains and their nanoscale structural organization, which may be important in shaping their transcriptional activity. The data shown here are taken from Boettiger et al., Nature, 2016.
Folding of chromatin depends on TF occupancy
Folding of chromatin within a domain is also different depending on the type of T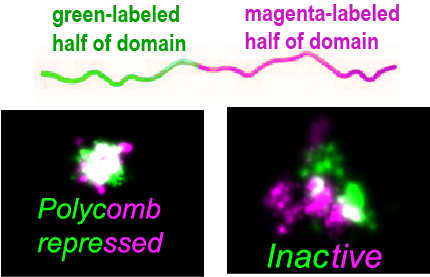 Fs active within the region. For example, we found that when we labeled part of a Polycomb domain green and the other half magenta, these two parts were highly intermixed, suggesting an entangled or overlapped state. In contrast, regions of Inactive or Active chromatin show sub-domains that overlap weakly at their boundary.
Domain interactions depend on TF occupancy
The degree to which adjacent regions of chromatin intermix also reflects the type of transcription factors bound to the domain. While adjacent regions both bound by Polycomb are highly overlapped, Polycomb bound domains next to Active regions are well separated (image right). Inactive domains also segregate from Active domains, but to a much lesser degree. Removal of one of the Polycomb factors, Polyhomeotic (Ph), leads to an expansion of the Polycomb bound domain and a loss of the domain boundary (image right). Mutation disrupting interaction between Ph proteins also reduce local contacts within the domain as assayed by 4C and abrogate clustering of Polycomb proteins in the nucleus.