10:00 am – 11:30 pm
Project 2
- see notes
- (mostly a tedious debugging session).
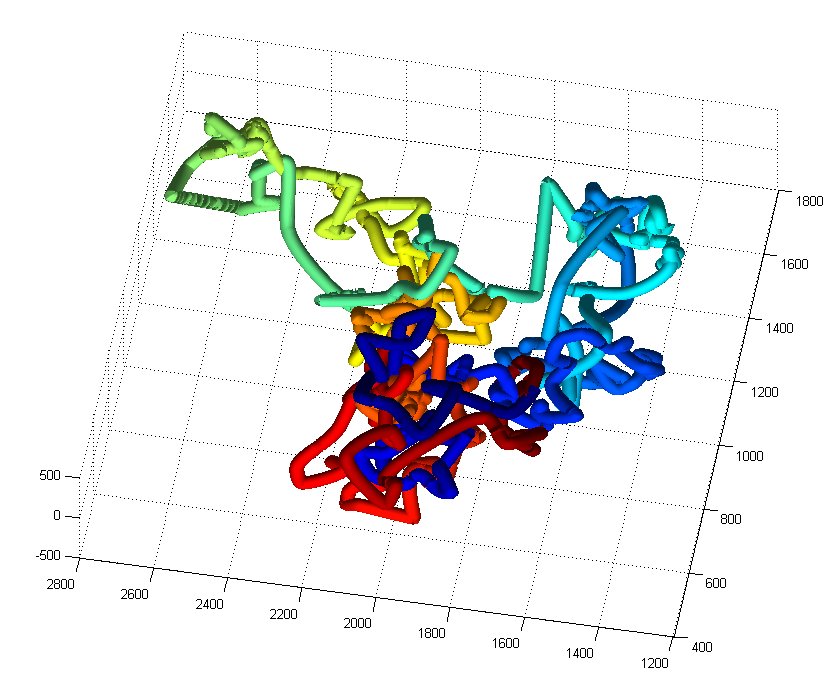
Chromatin Project, 3D interaction analysis
Shown left is the the two domains color coded.
Shown right, I’ve concatenated all the points from both molecule lists, and then plotted the shortest path through all points (travelling-salesman problem solution), with color representing order visited. As you can see, it does a pretty good job of separating these two domains.
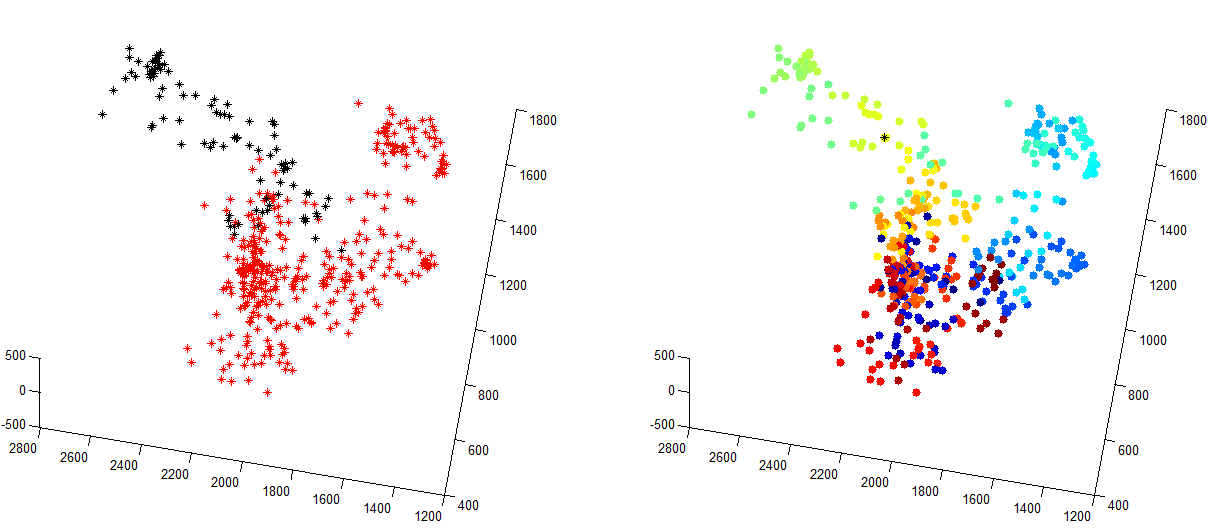
My TS solution is annoying slow, nor do I have a good metric yet for ‘converged’. In the images above I’ve downsampled the original data 10 fold so that it completes in a reasonable time. Given that it’s NP-hard I should also probably not be trying to do it in matlab, there must be a fast implementation of this in C…
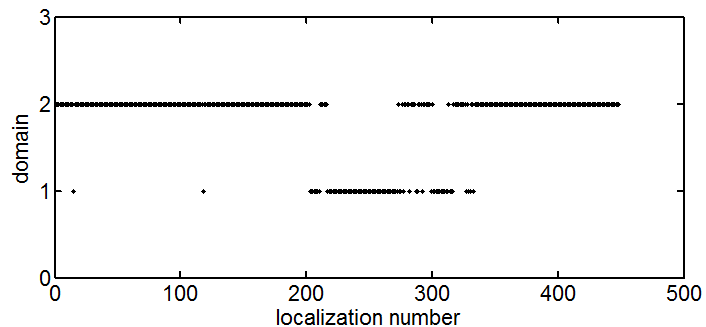
We then want to turn this into a simple scalar quantification of entanglement.
I think this can be done by looking at how often the TS-route switches between colors. If they are completely separate domains, it should start in one color and finish in the other. As the domains become more entangled, there will be more places where it switches back and forth between them.
Still, if we knew the location of one of the distal ends of the chromatin that we could use as a start point for the route. Then if we also knew we had only a single polymer fiber (rather than a homolog bundle) and if our localization density was high enough, we we could have a decent guess as reconstructing some of the polymer topology. e.g. something like: