

 Working on analysis for MGa1x vs 2x.
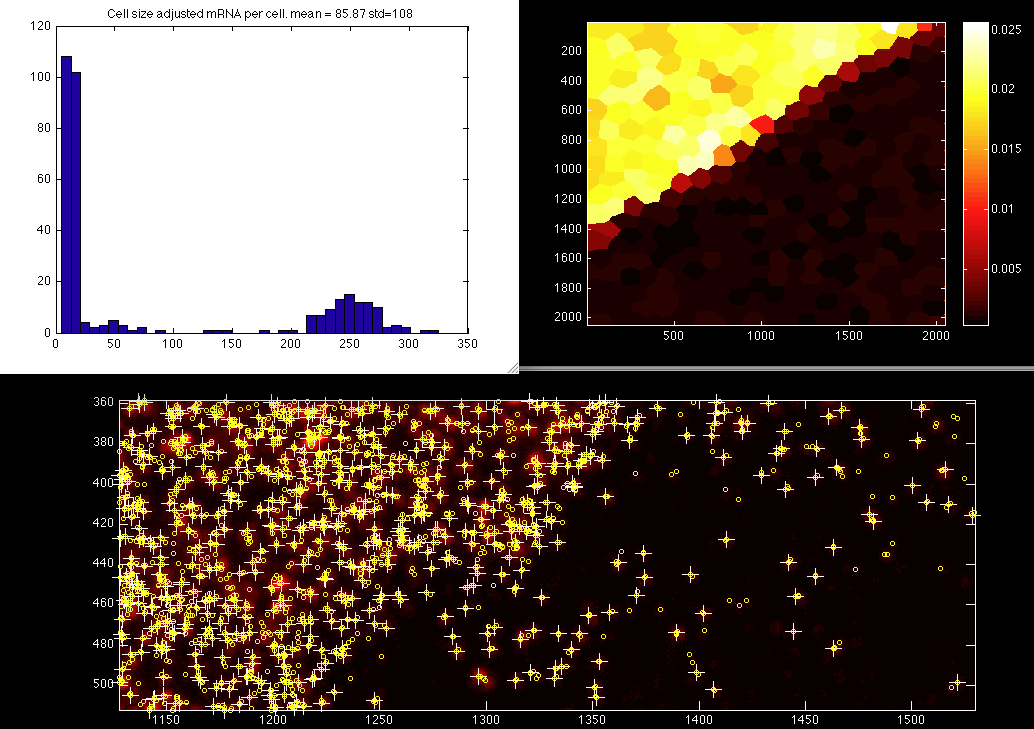
Shown left, mRNA densities for MGa2x. Internal control for MGa2x achieved by measuring expression.
With Mga 1x, compare ush(?) intronic probe as a measure of background. Only 0-5 dots found per cell. dotfinder finds moderate numbers, CheckDotUpDown finds very little correspondance, keeps background low.