10:00 am – 1:00 pm
MERFISH analysis
- managed to get L11_jumbled data through the pipeline
- counts look low
- explored two lower thresholds (original was at 1000), tested 400 and 700
- these actually make more the cell-by-cell correlations lower. Tested higher 1600 threshold that looks a bit better
- this threshold effect might be just the issue of including FLNA and THBS1 and getting zeros for low genes plus something for these — not sure it is a good guide.
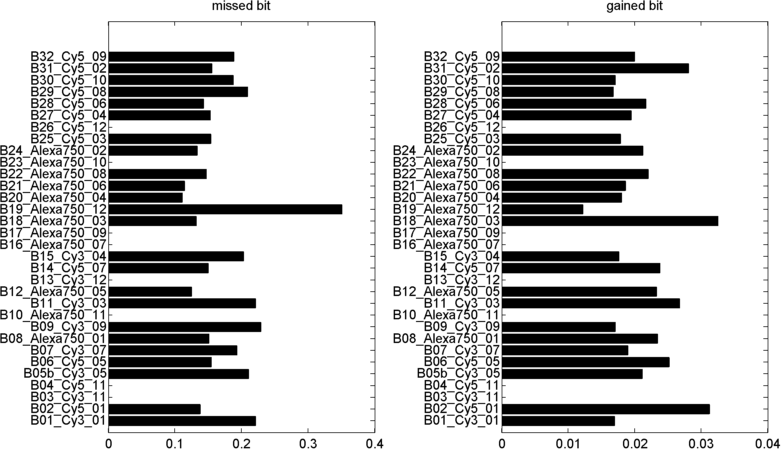
- the hybe-hybe data does not look very clear
Ph paper
- revised model discussion again.


