
9:00 am – 5:15 pm,
Looking at HS data
HS transcription
Data from Gonsalves et al 2011 PLoS ONE paper.
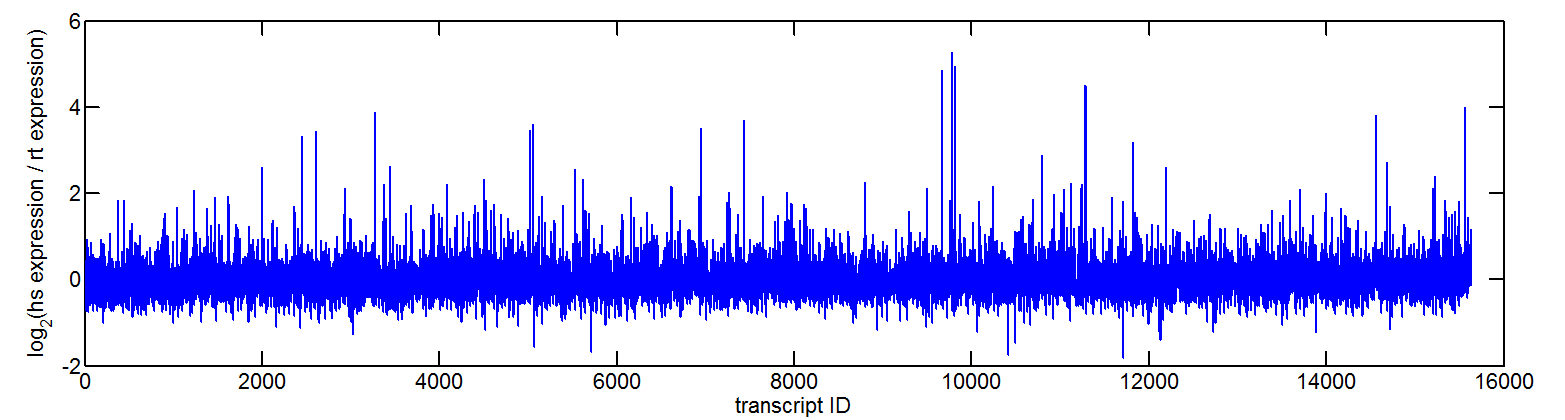
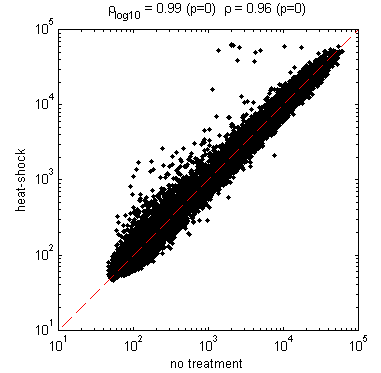
20 min probably not enough time for a lot of degradation — don’t see much down regulation
See the few HS genes (like hsp70) which are supposed to be rapidly up-regulated come on.
Let’s look at transcription factors and PolII binding instead.
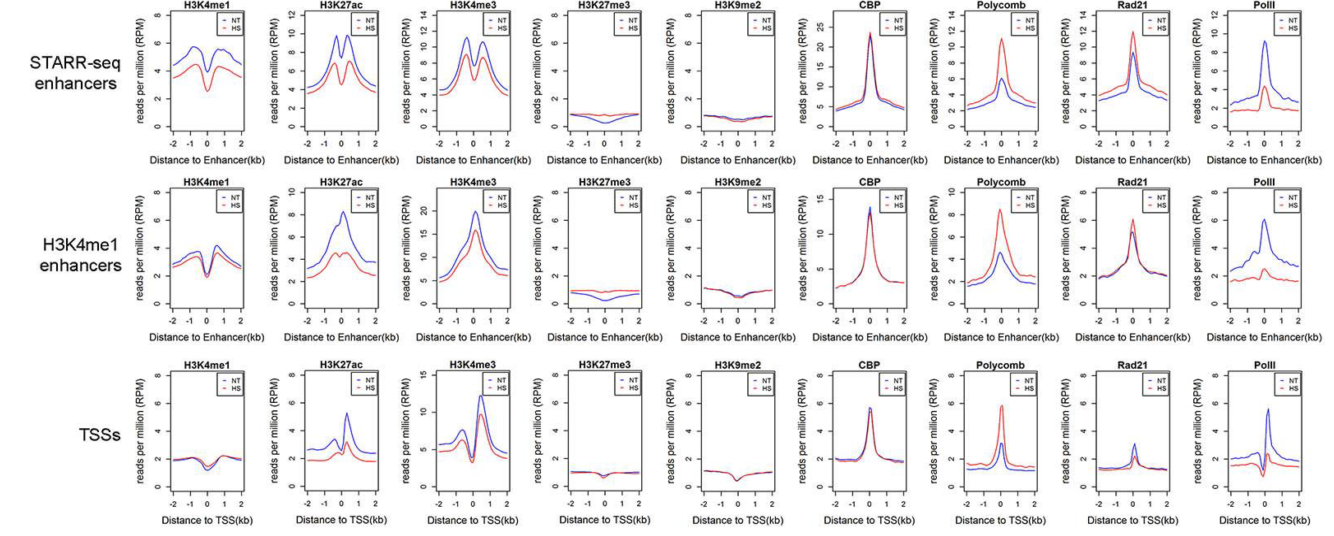
ChIP data (from Li et al 2015 Mol Cell paper from Corces lab)
Large active locus:
so far looking good — active marks are being depleted, PolII drops.
What about at some heat shock loci?
Summary from Li et al 2015 paper:
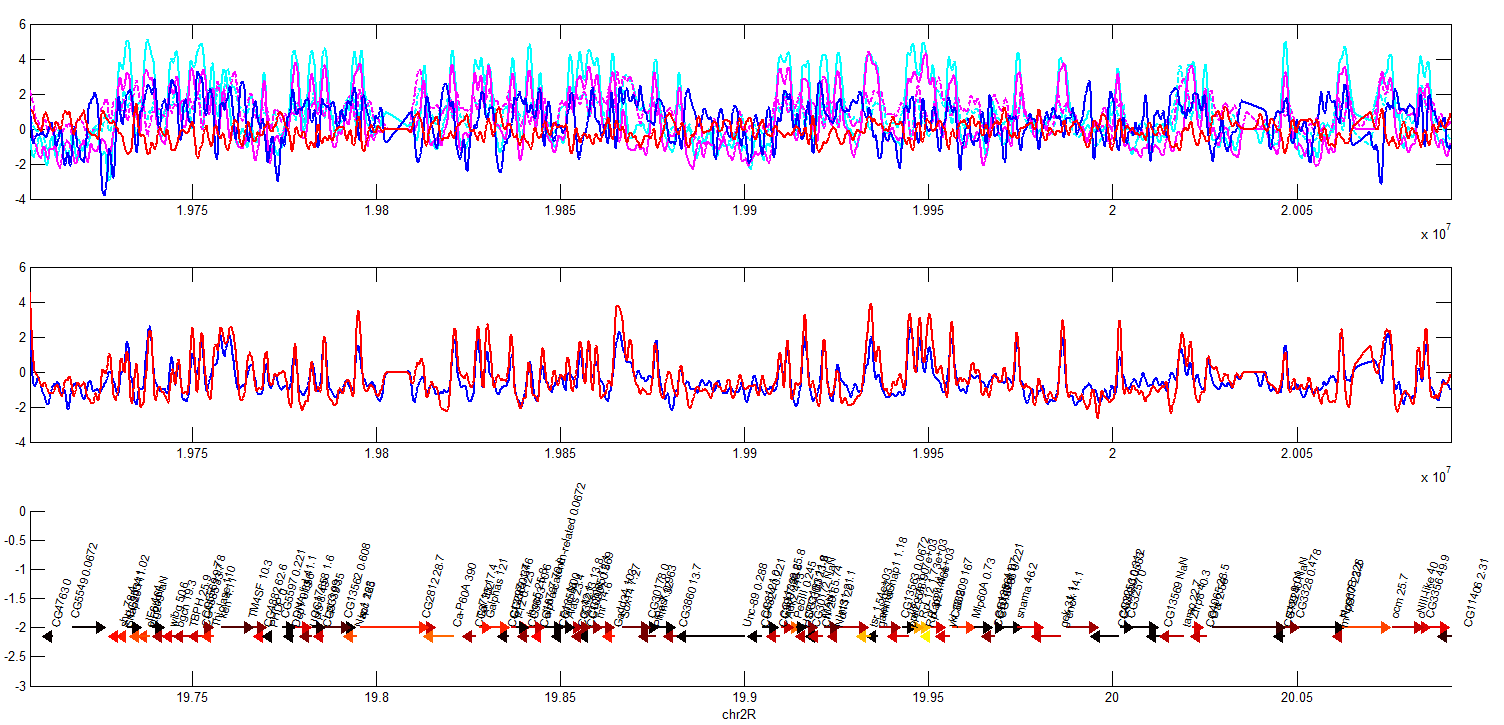
A closer look at the data
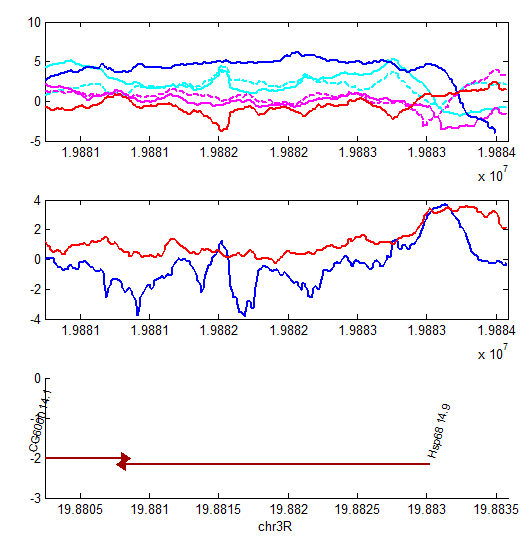
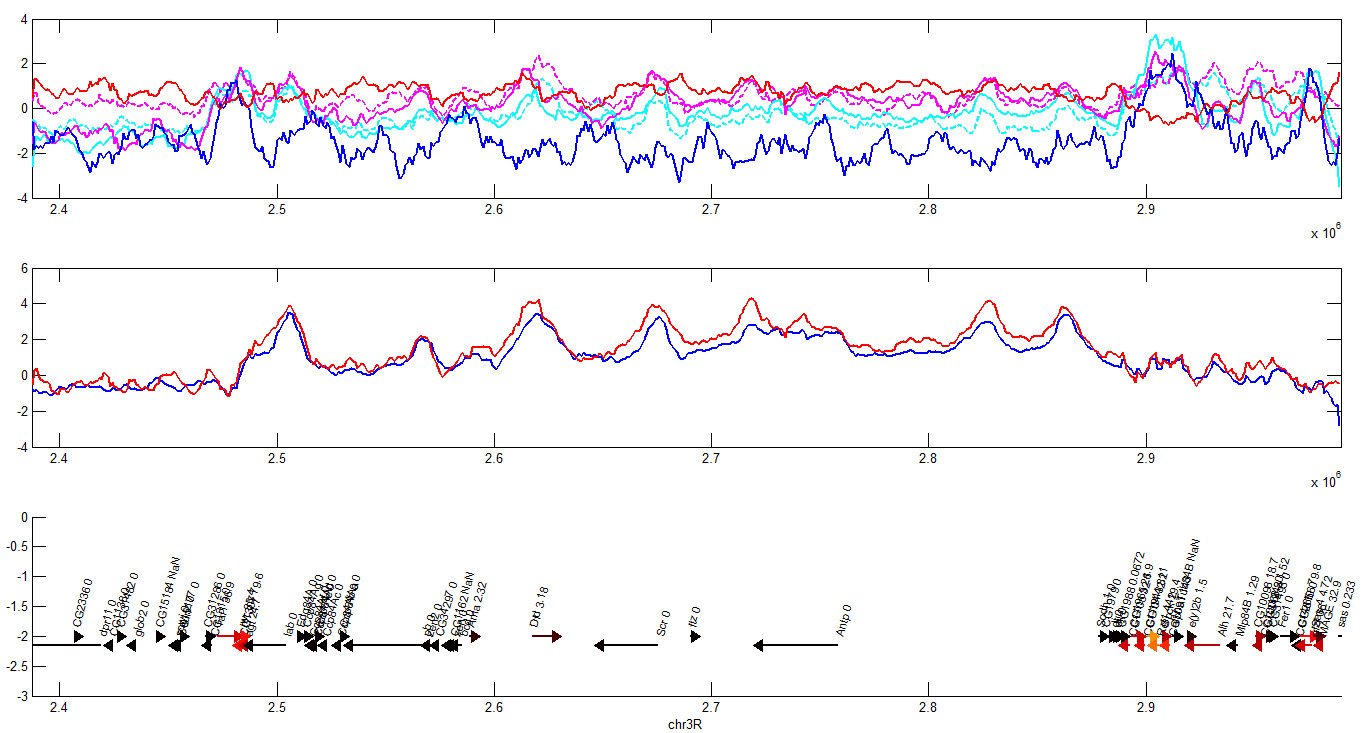
- Top panel
- red HS-PolII
- magenta HS-H3K4me3
- magenta dash HS-H3K4me1
- blue NT-PolII
- cyan NT-H3K4me3
- cyan dash NT-H3K4me1
- middle panel
- red: HS-Pc
- blue: NT-Pc
- lower panel
- genes, color coded by expression.
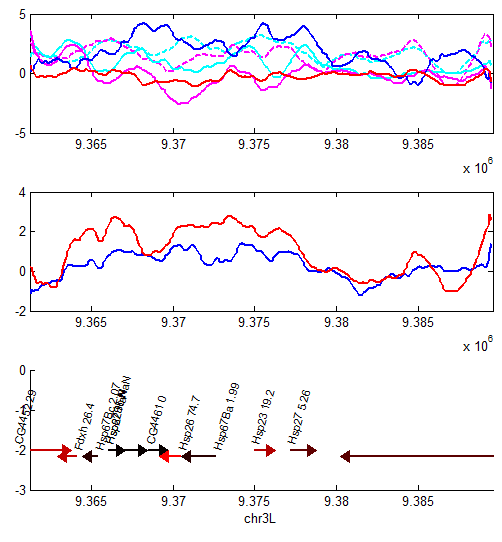
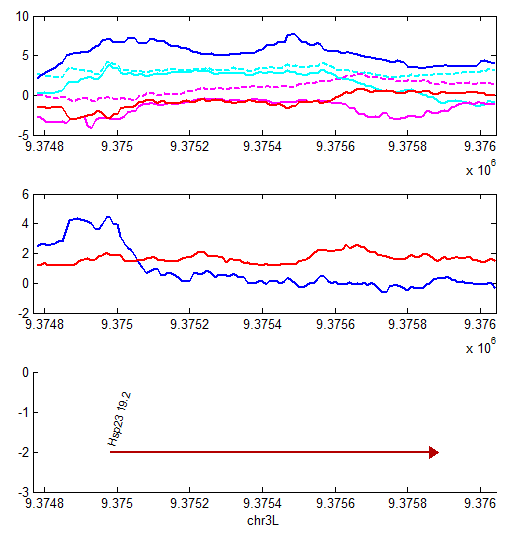
This is more troubling, PolII largely goes down, even though I validated that expression of the genes increases according to the Gonsalves et al 2011 PLoS ONE paper
what about a silent locus?
- here’s ANT-C. This is also confusing. expression clearly increases, but so does Polycomb
MERFISH
 <ul>
 <li>discussion with Jeff</li>
<li>should start the L15 data processing (first full dataset in a while acquired over the weekend).</li>
 </ul>