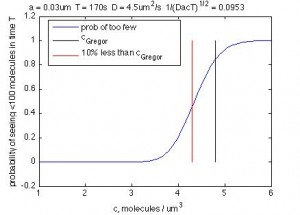
To count all 770 molecules in the nucleus according to Thomas data (D =1, c=4.8, a=.003) would take 890 minutes (and give 3.6% diffusion error).
naturally 100 molecules gives a std/mean 0f 10%, and is thus the natural threshold for the number of molecules that need to be counted to match the data, which is also measuring noise in terms of CoV. Note this is NOT the same thing as 10% error rate (i.e. the 10% of cells getting less than the threshold amount).
To count according to Dostatni 100 molecules takes 25 minutes.
With my correction to `detector size’ and looking at the Poisson distribution of number of molecules and integrating up to 100 molecules to find the probability that a cell in the region with mean concentration c is of off, I get (plotted as a function of c):

