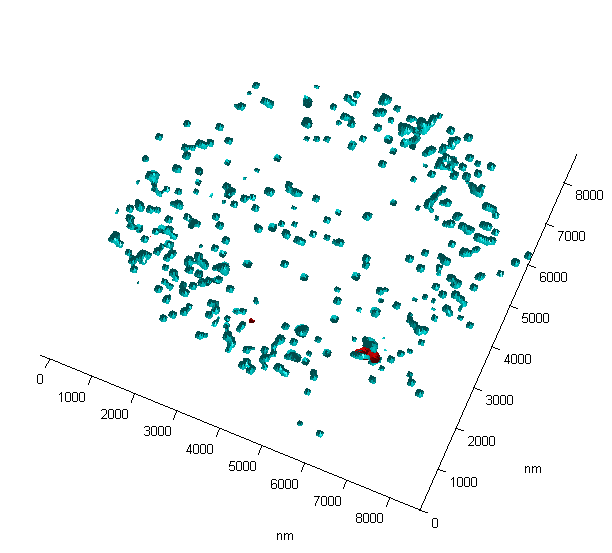
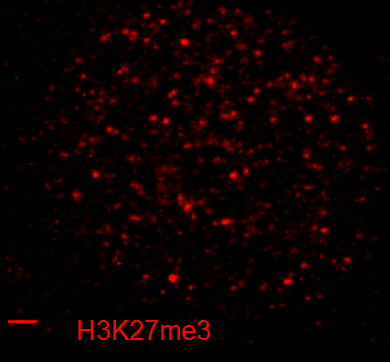
K27me3 post-in situ labeling turned out pretty sparse. Still have a few thousand localizations for which cluster nicely in several cases at the BX-C locus.
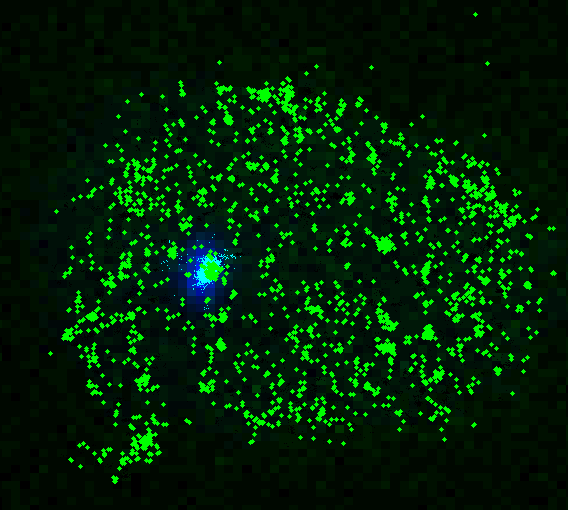
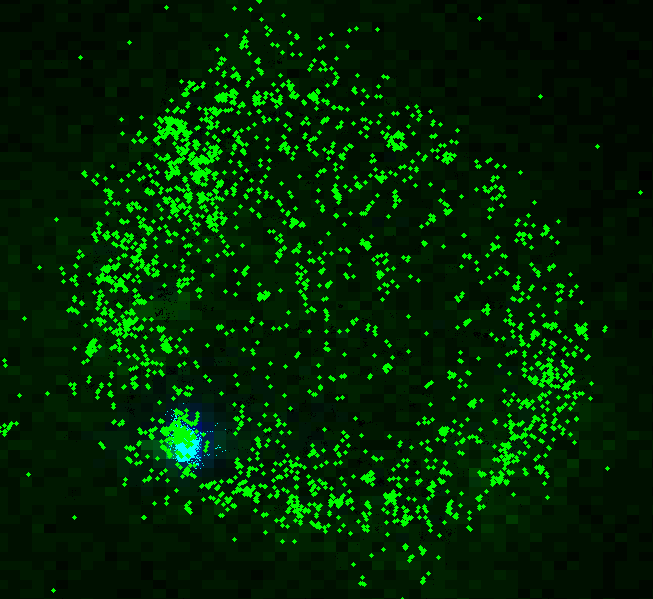
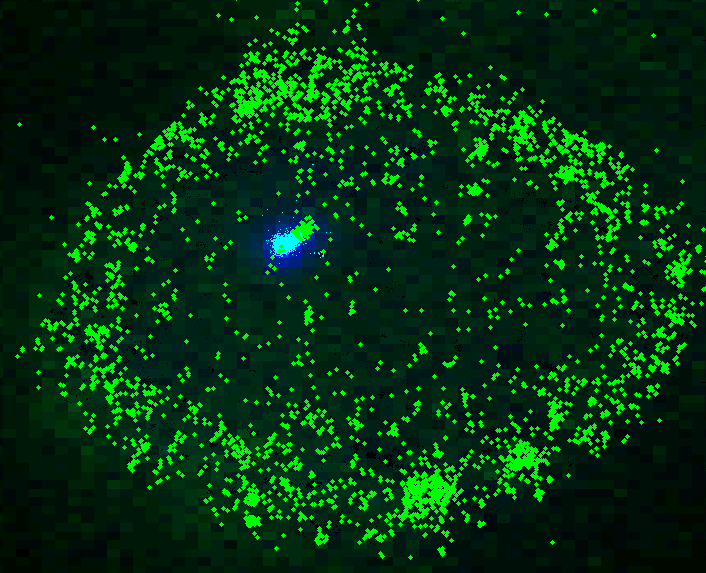
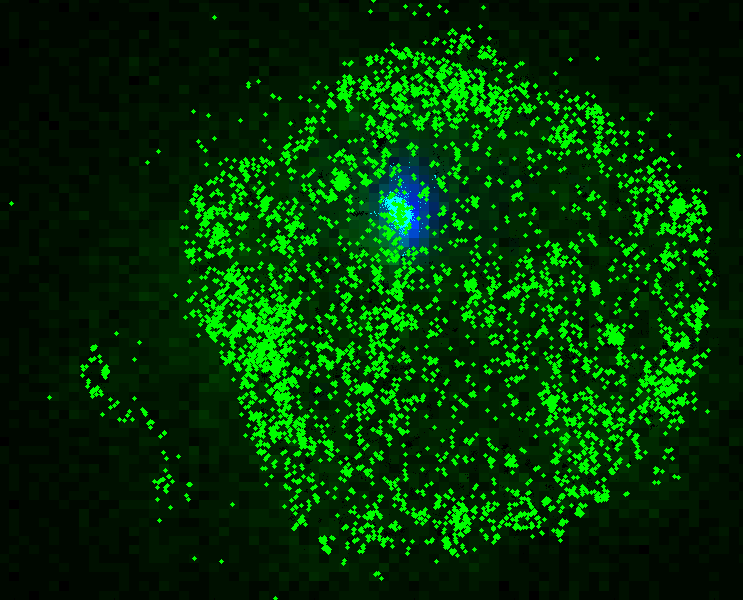
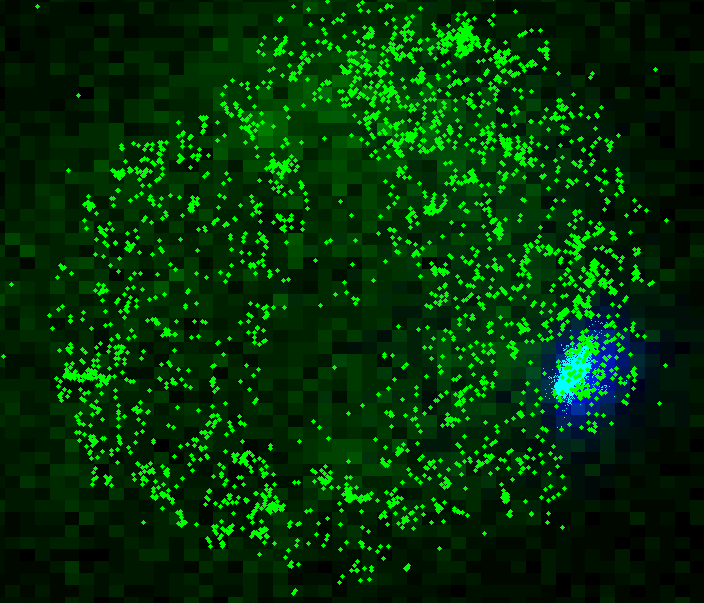

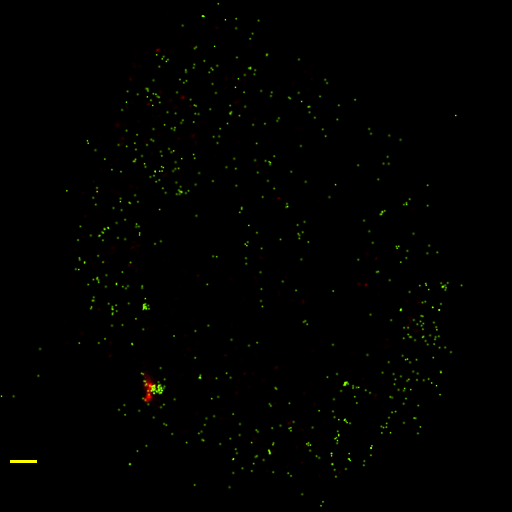
Overall this 488 staining is very sparse, there are maybe an order of magnitude fewer localizations than I would expect. Fewer clustered structures are evident than in previous images: (large cell is S2 cell, H3K27me3 in cyan against a pan-histone marker in red or alone in red. Small cell is from embryo cross-section, H3K27me3 is in yellow, H3 is in red). The S2 cell has also been treated for DNA-FISH to label AATAT repeats (not-shown) and the embryo has been RNA-FISH treated prior to immuno-labeling for Ubx-expression (blue, conventional resolution).
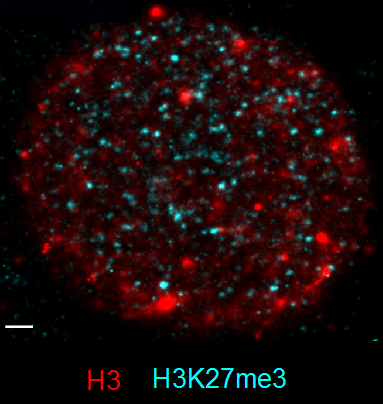
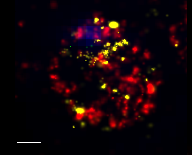
The scatterplot also makes the more image look more diffuse than it really is, since piles of dots on top of eachother don’t get any brighter and a light scattering of spots looks pretty dense — My GPU image rendering failed over the weakend while I was doing the plots, but I’ll get it fixed.