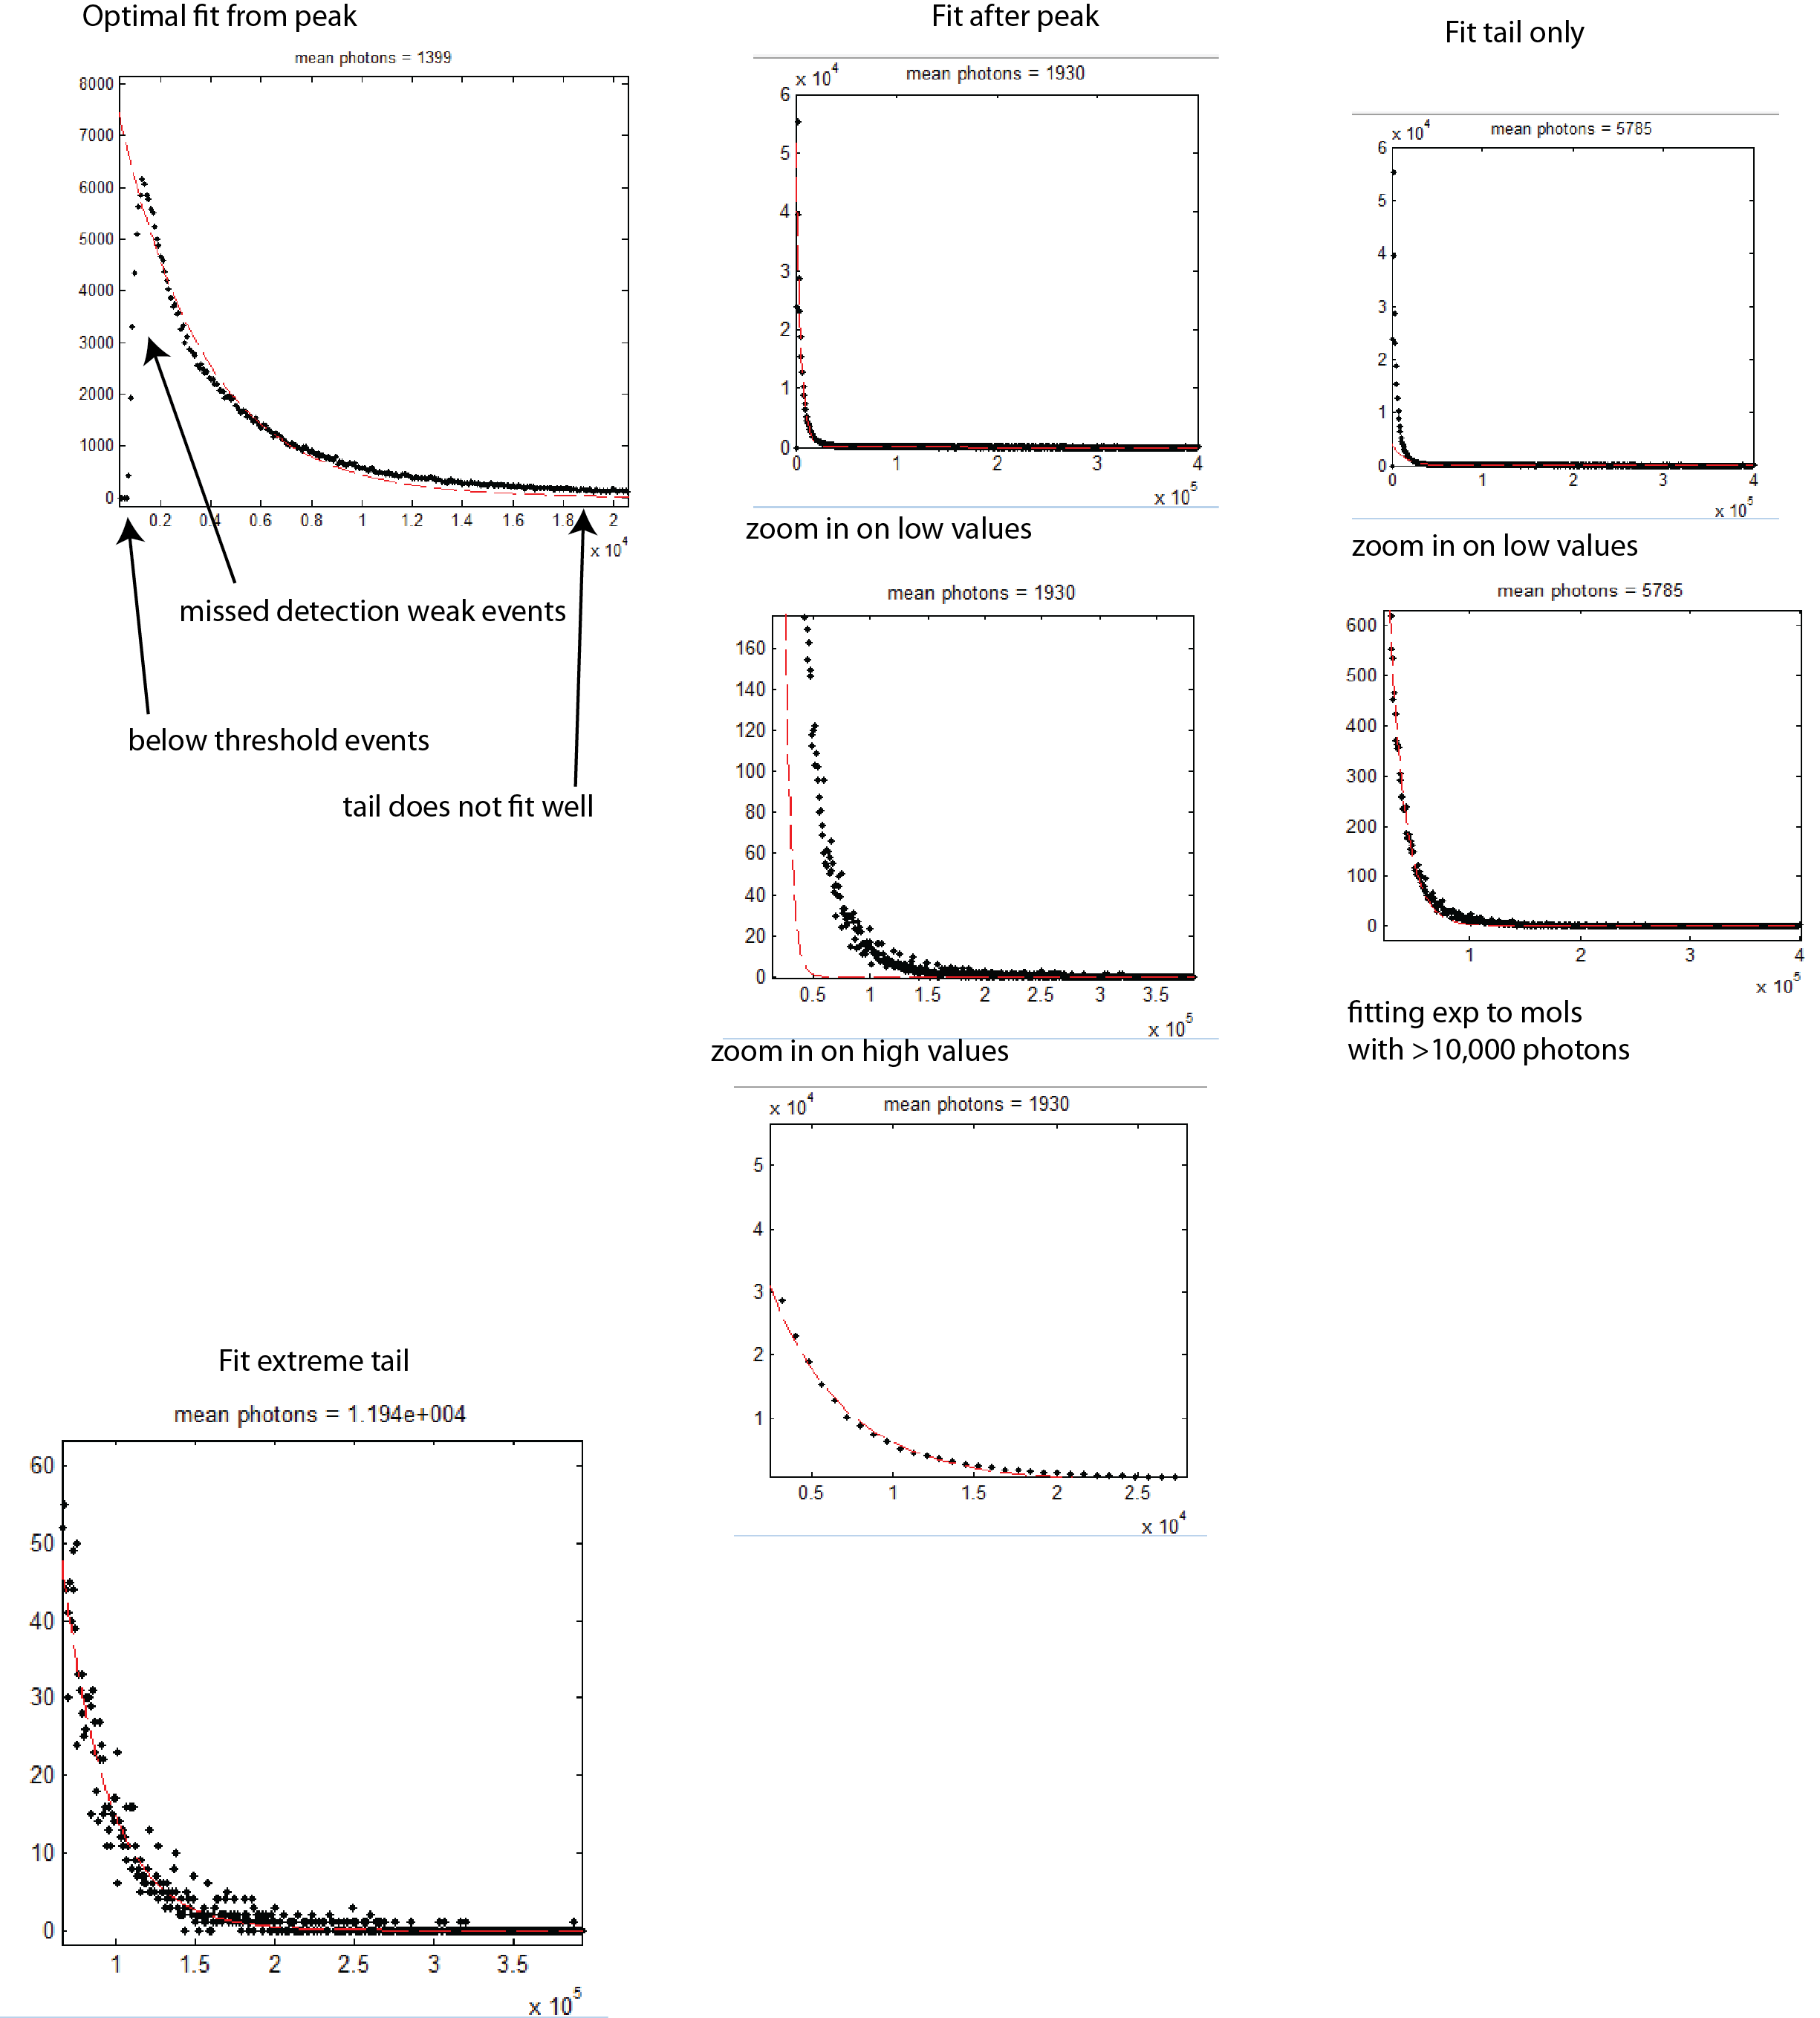
Fitting exponential distributions to molecule areas output from insight, multiplied by photon per count for gain 30 on STORM2 (.41 photons).
These data are all from Hazen’s 2D microtubules. My 3D microtubules, Yari’s 2D sections, my 2D sections, and Shu 3D workshop mitochondria all give similarly shaped distributions (heavy tails that make tail-fitting seem rather subjective).
Comparing data files from Hazen (MTs, above), Shu (workshop data on mitochondria in 3D) Sang-Hee (microtubules) and my data (SuZ-750 K27-647), see similar distributions of molecules (differ maybe 20% in fits and up to 50% in average intensity values).

