
9:30a – 11:30p
Analysis to do:
- Finish analyzing E10 data!
- analyze E08 data
- E01 data, first image looks okay, rest have no obvious dots. STORM movies not too much blinking
Presentation to do:
Spot analysis
- Pool all regions analyzed, plot localizations vs. size
- Yellow spot summary
- Blue spot summary
- Green spot summary
- red spot?
STORM analysis
- computer accidentally restarted (lost power?) during save data of E10. pooled data file corrupted. Data lost.
- Could write a loop to go back through the vlists and maxis data for the individual files and reconstruct this data.
- Analyzing E10 RNA and DNA data on Cajal.
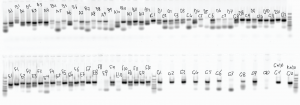
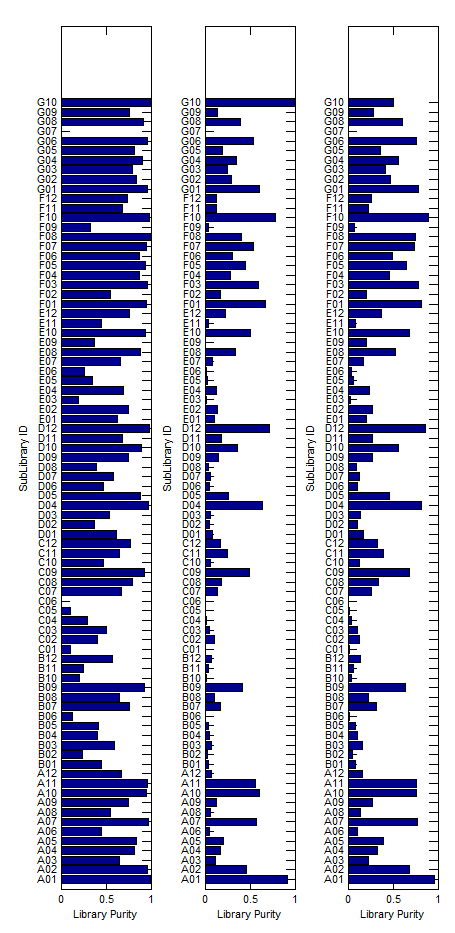
Library sequence analysis
- loading
.matfiles for parsed genome data takes forever. - (should just specify a few variables to load).
- New function from Jeff
GenerateSequenceDataStructure.mconverts matlab’s bioIndexed structure SAM data for an array of structures to a single structure of square arrays. This is much more memory efficient and mobile — matrix like / square structures can be easily held in a block of memory. - comparing frequency of primer – probe matches in sub-libraries in different pools of PCR.
- first PCR is common too all 3 pools, this was then split to add adapters via another 10 rounds of PCR, and split again to add NEB indices via a further 10 rounds of PCR.


Ph model
- concentration of PhM at which the system switches from being highly clustered to weakly clustered depends most strongly on chain length
- The sharpness of this switch also depends strongly on chain length (I guess that part is less surprising).
Working on XZ meeting prep
- See presentation in Google Drive
Feedback
- go ahead with simulations for Blue hypothesis
- the polymer model recapitulates the box effect (should be true, this may be directly shown in the Nicodemi papers.
- the contact maps for individual
- subregions of a condensed domain have larger area (radius of gyration?) relative to length than the region as a whole (or than subregions flanked by non-interacting sequence).