
11:00a – 9:00p
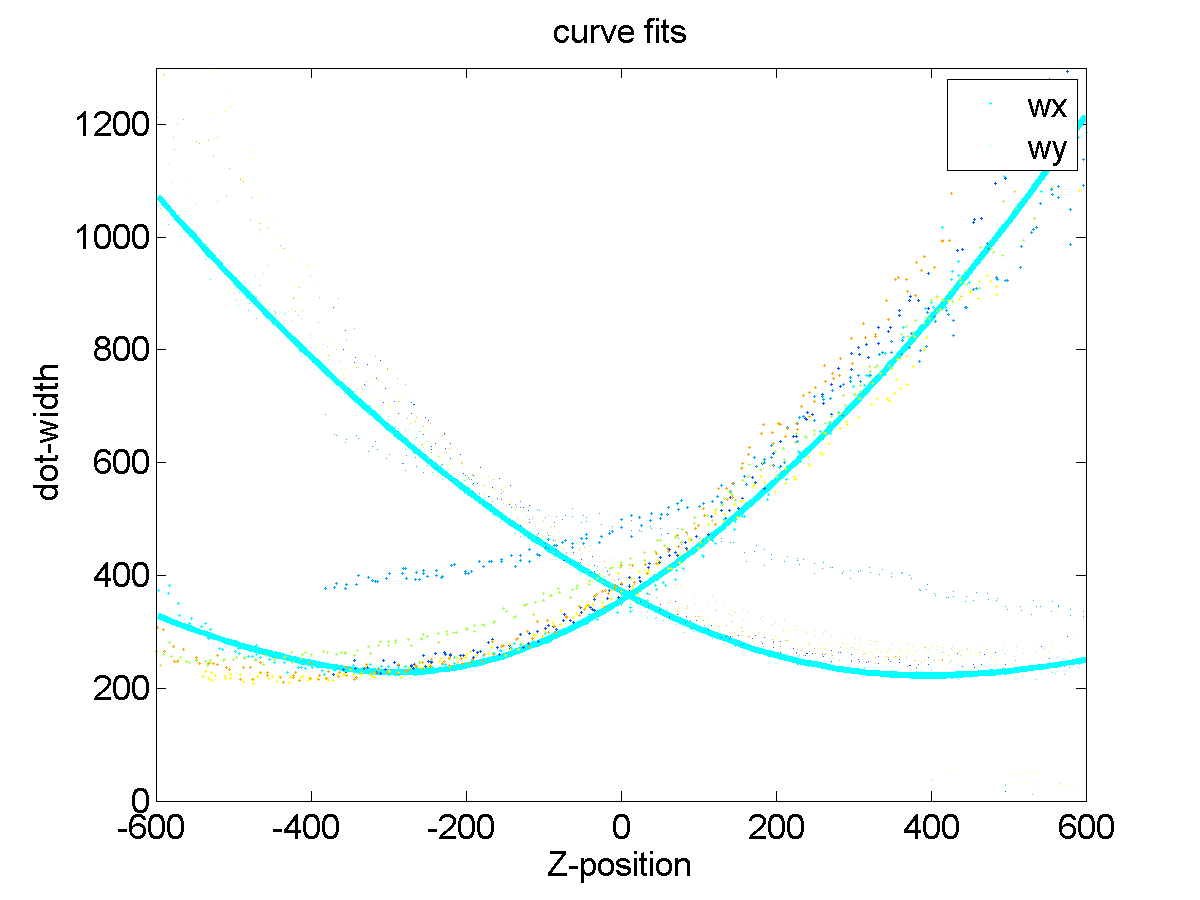
z-calibration
- some new ideas for finalizing new z-calibration routine:
- see if different starting z-position affects curve alignments (isn’t that the whole hypothesis in the first place?)
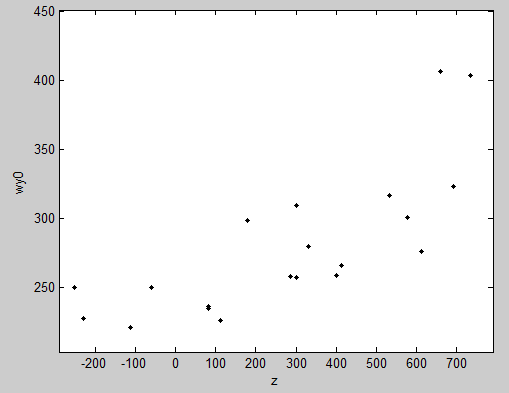
- well, all the data comes from the same range, but the 0 crossings really are a different points and thus should have different shapes
- this seems to be true just looking at scatter plots of offset vs. fit parameters.
- Just use calculated curve fit from the bead with the most centered trace.
- Update STORMfinder to use this new method
- Successfully integrated new Z-calibration analysis routine


Cell staining
- Rinse out secondaries
Probe making
- RNA cleanup 1/2 of samples 1 and 2. Respective RNA concentrations = ~1200 and and 1300 ng/uL in 30 uL (originally at 10uL volume)
- Try RT at different levels of dilution. (all with primer P1)
- 3 uL primer + 5 uL RNA + 2 uL dNTPs + 4 uL ddH2O Then 5 uL of buffer, RT, RNase inhib mix. (20 uL) Samples 7 and 8
- 3 uL primer + 5 uL RNA + 2 uL dNTPs + 19 uL ddH2O Then 10 uL of buffer, RT, RNase inhib mix. (40 uL) Samples 7 and 8
- 28 uL dilute, purified RNA + 6 uL primer + 4 uL dNTPs Then: 12 uL of buffer, RT, RNase inhib mix (50 uL) Samples 1 and 2
- all told need 54 uL of 5x buffer, RNase inhib, RT. 45 uL 5x buffer + 10 uL RNase inhib, + 2 uL Maxima
- all samples equivelant to the 6 uL primer into 10 uL RNA we tried before in 30 uL.
- sample order: 7-20, 8-20, 8-40, 8-40, 1-pure-50, 2-pure-50