
10:00a – 7:15p
Deep sequencing analysis
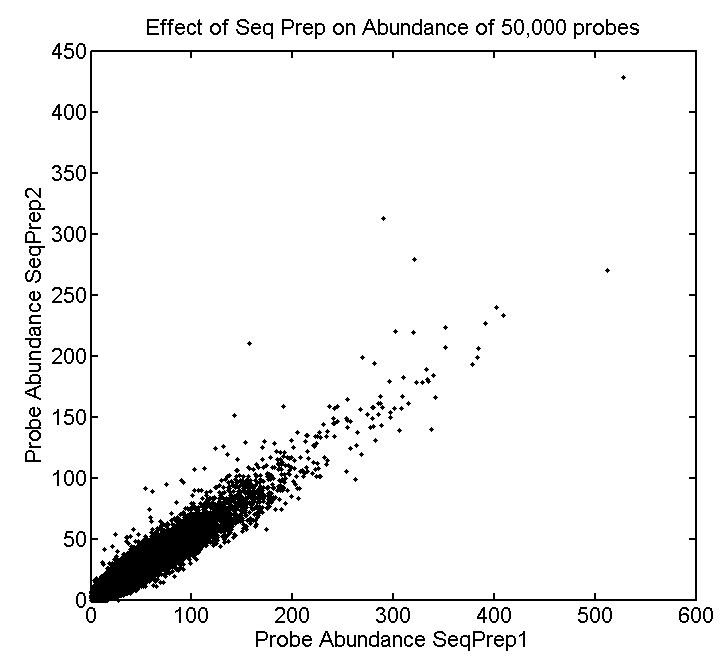
Effect of Seq Prep on Abundance
- Prepping samples for sequencing this time at least doesn’t seem to introduce large distortion in abundance.
- Would have been good to sequence these libraries much deeper though, average read depth on the best sampled is 20 reads. Lots of the variation is in the single count reads. Would be good if everyone were mostly over 100 reads.

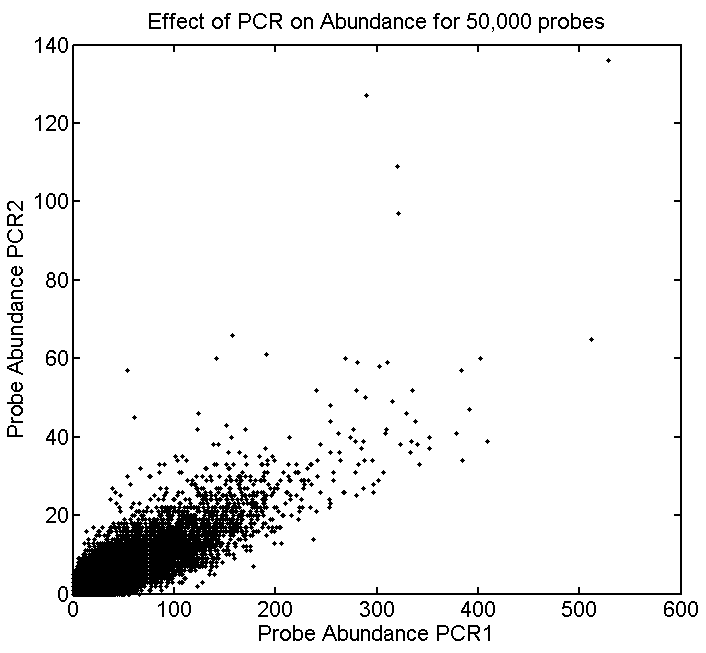
Effect of PCR on Abundance
- these measurements were sadly impacted by the very low concentration of the second duplicate PCR prep
- (all of which dropped in the two gel extractions after sequencing. Probably mis-trimmed the block. Then weaker bands got harder to see and trim right)

Reproducability of Abundance variation in probe sets
- note the ~100 fold variation in relative abundance within a probe set.
- however almost all the probes are within 10 fold of the most abundant, its just a few that lag out.
- of the ~250 in the F12 data set, all are present.
- Seems that the same sequences get over-amplified each time, and the same sequences lag behind.

Ph Project
STORM
- 2D imaging, matched COT + BME.
- imaging WT anti-flag + anti-Ph + anti-Dm0 in 647 STORM with conventional images of BXC and ANTC
- FISH spots look great. Cluster density looks low, but lets wait till we get a proper dot fitter and can see the contrast.
- hard to tell colocalization at this resolution.
- need another beadset before we switch! (need non-3D beads).
New cell staining
- stain new S2 cells in 561 with anti-Ph to see PcG bodies.