
9:30a – 9:00p
Ph project
- Finish O/N STORM run
- Take IR bead images (slide is also getting clumpy. Maybe we need to stick these down with EDAC. I think making slides for long term storage with Glox is also a bad idea, brighter to start with but shorter shelf-life).
- start copying data
- PhM data still fitting
- Psc Ph data finished analyzing (72 hrs).
- start re-running Ph folding sims with revised correction of clustering based on unbound fraction.
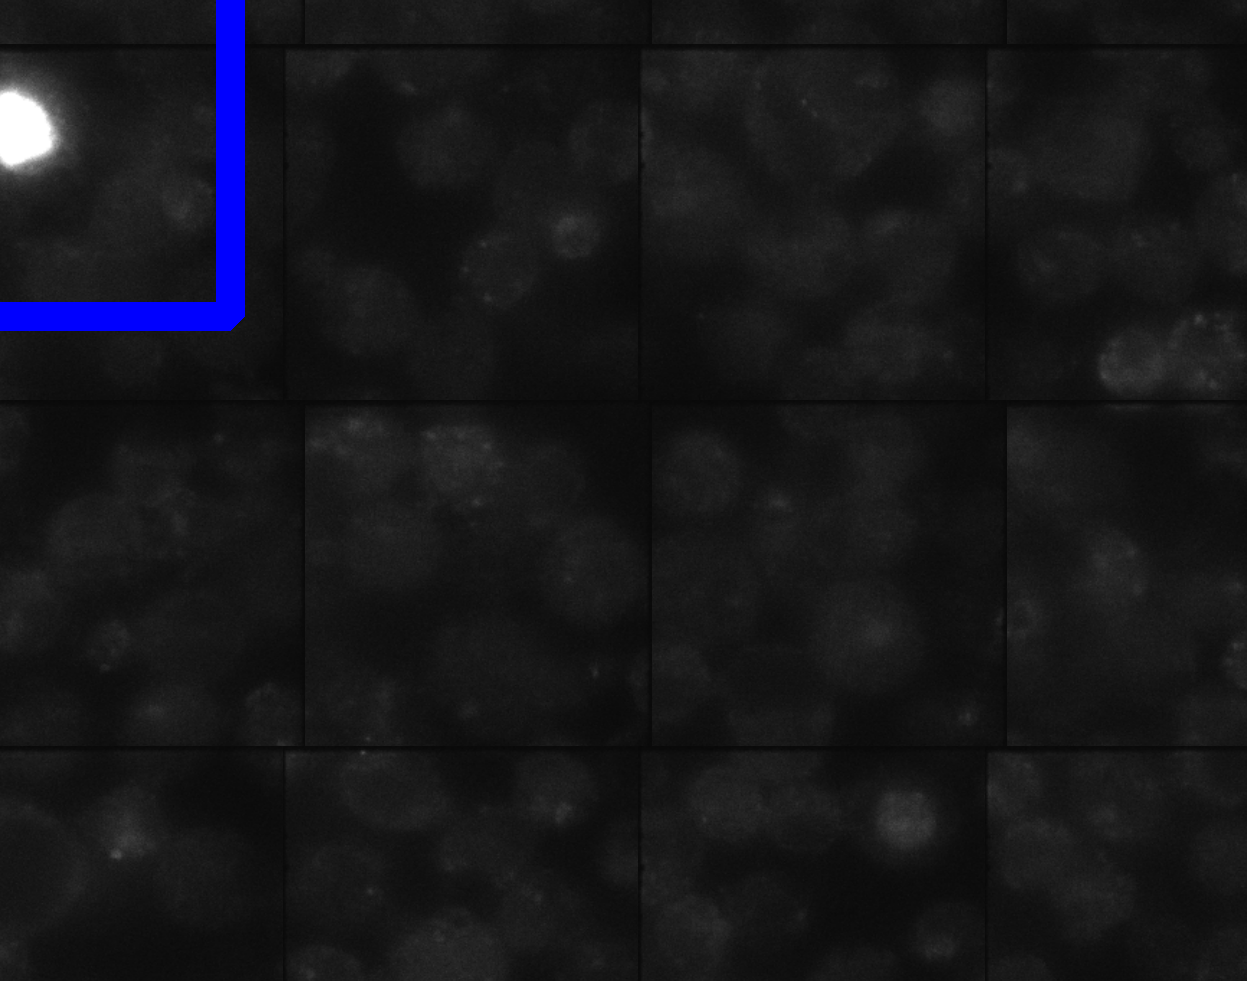
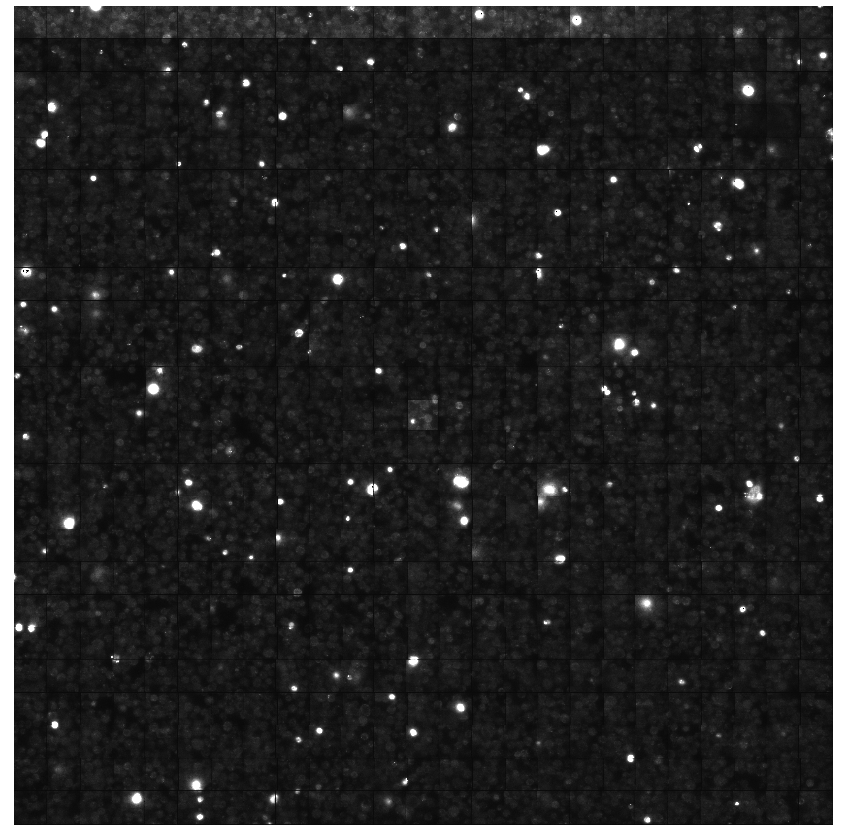
Variable density of Ph staining (all cy7-Ph-flag staining in Ph Wt background):
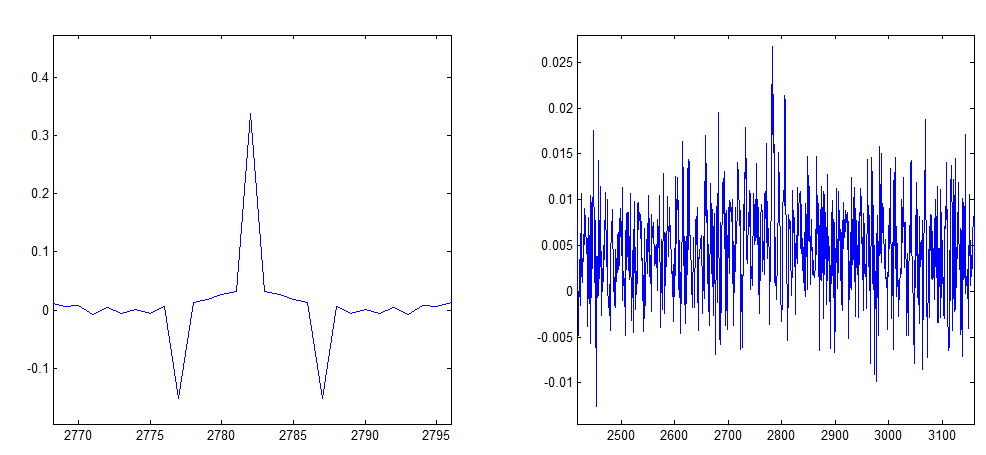
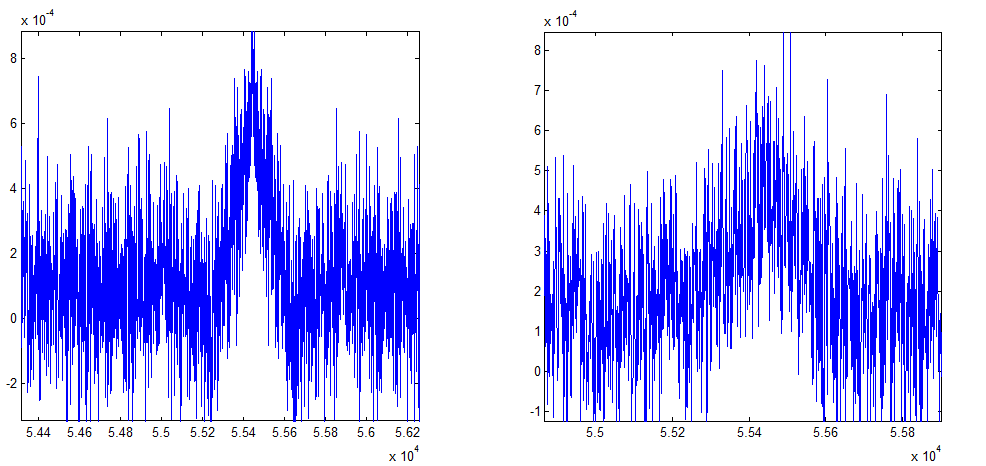
More drift analysis
Installed inpaint_nans.m from matlab file exchange to interpolate through NaNs (frames in which beads were not detected). This is required for the cross-correlation to work properly.
Averaging 20 frames (5 Hz), and then smoothing 20 frames, cross-correlation between beads on small time frame is mostly correlated
Auto-correlation is shown on the left, cross-correlation to other beads is shown on the right.
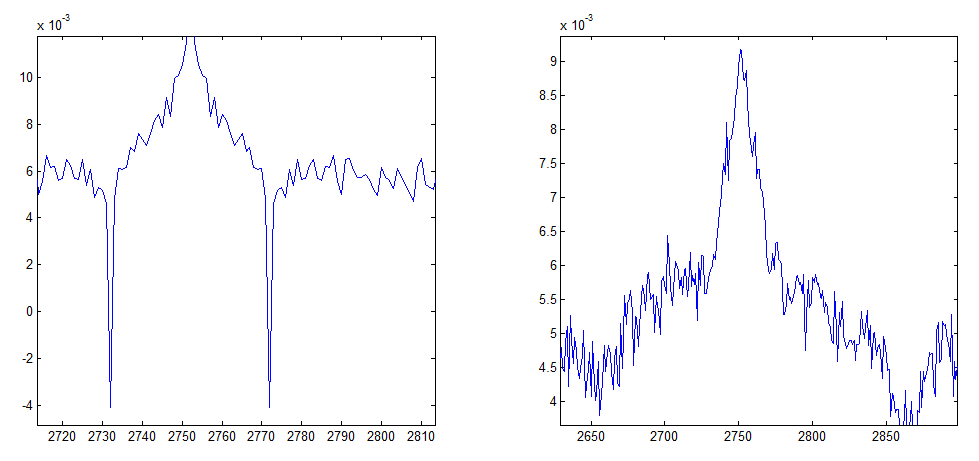
Determining ideal down-sampling
- comparing 20 frame averaging to 400 frame averaging
- 20 frame averaging + 20 frame smoothing filter looks better, let’s see how this compares to 400 frame averaging.
Library3 Prep
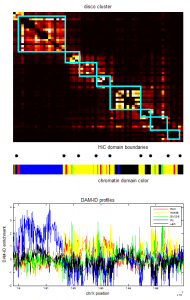
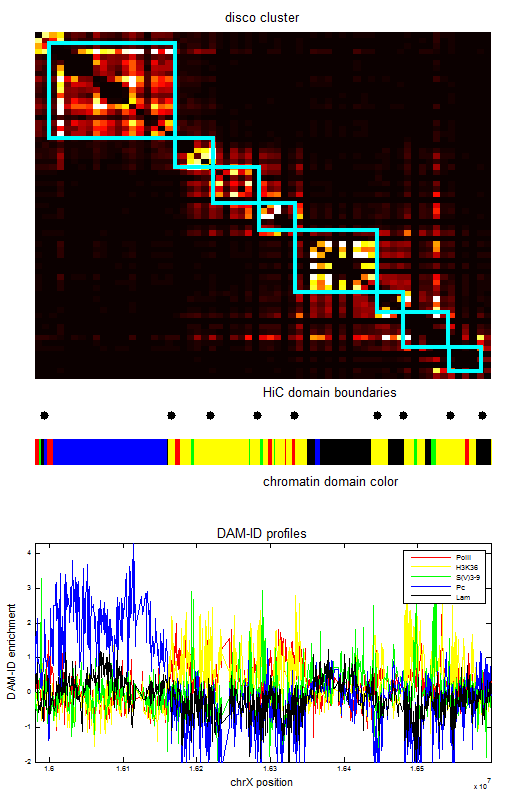
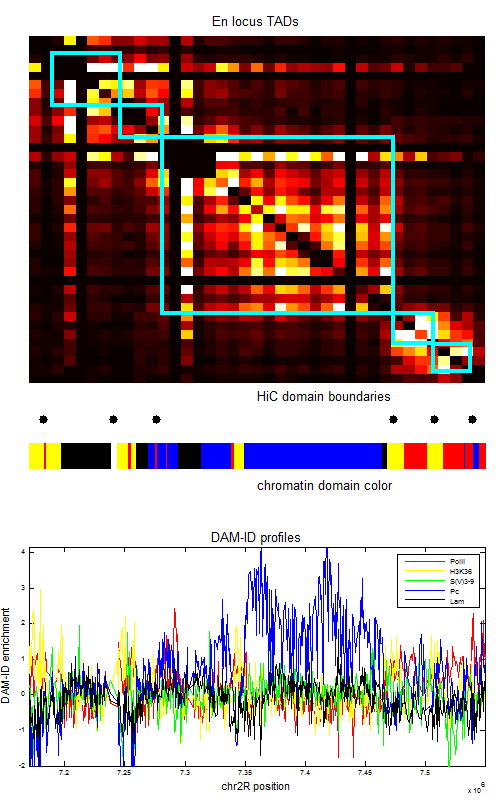
- choose black subregions form a solid black TAD (from chr2L)
- choosing TAD regions
New cell staining
- G1-P1 (positive control)
- F3-P1 test
- F4 P1 test
- used 12/14 fixed and prepped cells.
- No RNase treatment (these are all fully silent regions).
- .5 uL secondary, 2 uL primary each. Used previously successful secondary aliquot (I had doubts about some of the aliquots, switching aliquots earlier correlated with success / failure of staining). Used hybe dilution mix.
- pre-hybed about 5 min at 47C prior to adding probe, then about 1 hour at 47C after adding probe while heat block was stabilizing for denaturation.